
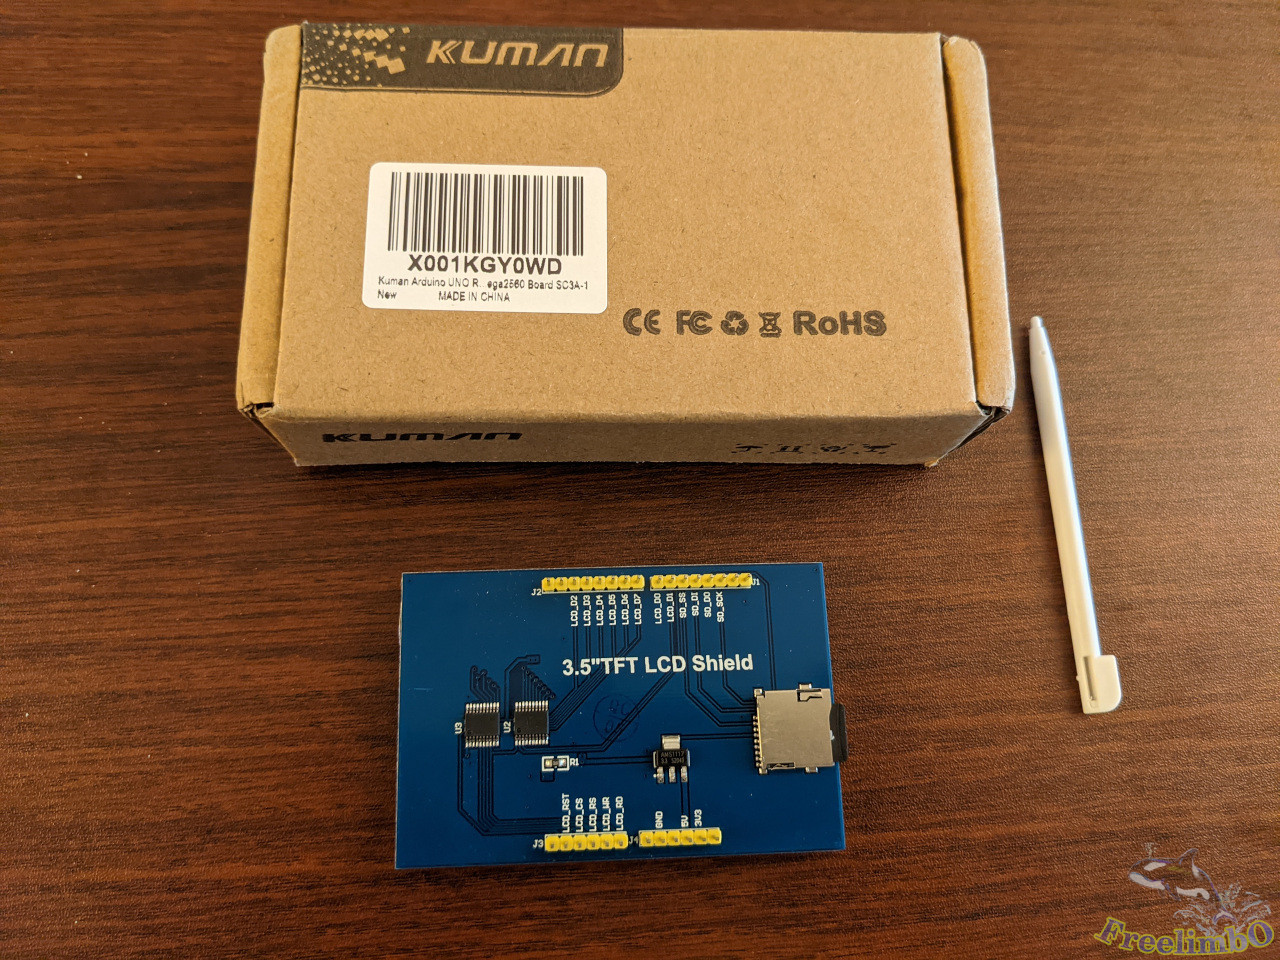
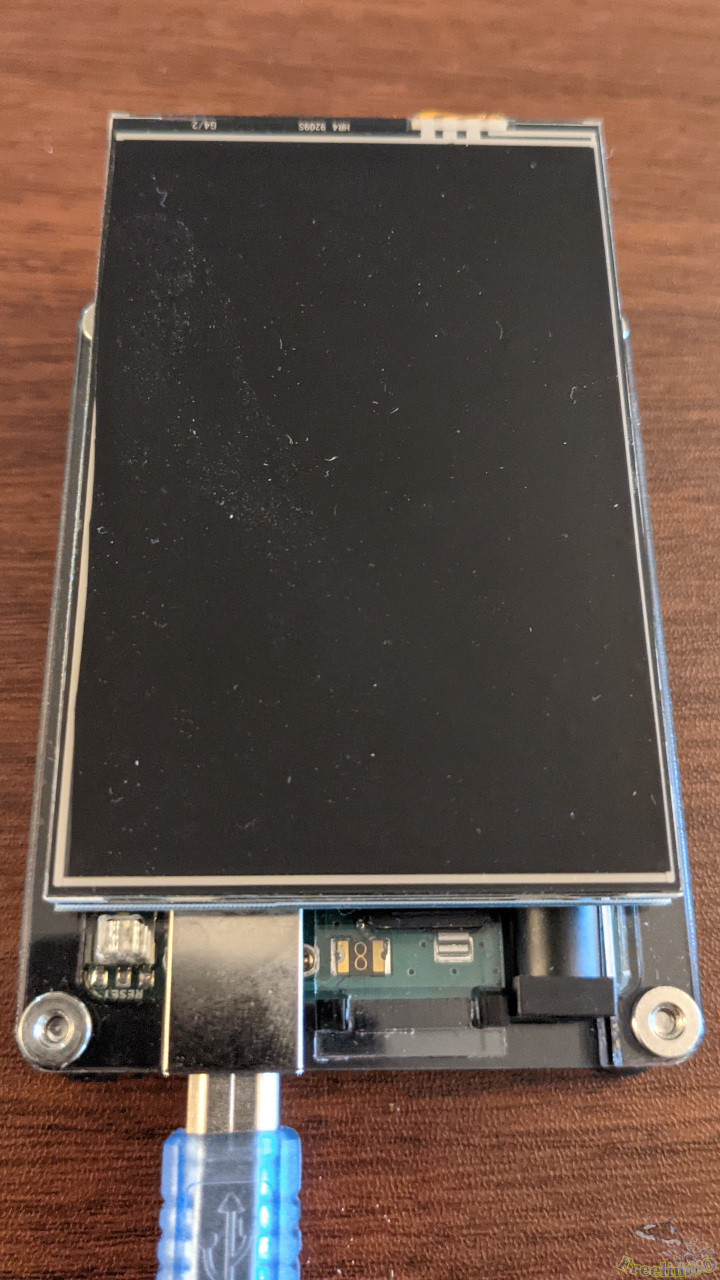
Devices: Arduino UNO, C4Lab Case Kit Zebra, Kuman 3.5 inch TFT LCD, and a micro-SD card.
Since I built my gaming PC, I often wanted to check the workloads on my CPU and GPU while I was playing and streaming some games. I know there existed some Windows apps that created overlays on the screen to show the hardware status, but I would like to keep my screen as clean as possible. So I got a solution to build an extra small screen serving as a PC panel.
Micro-controller: Arduino UNO R3 Board
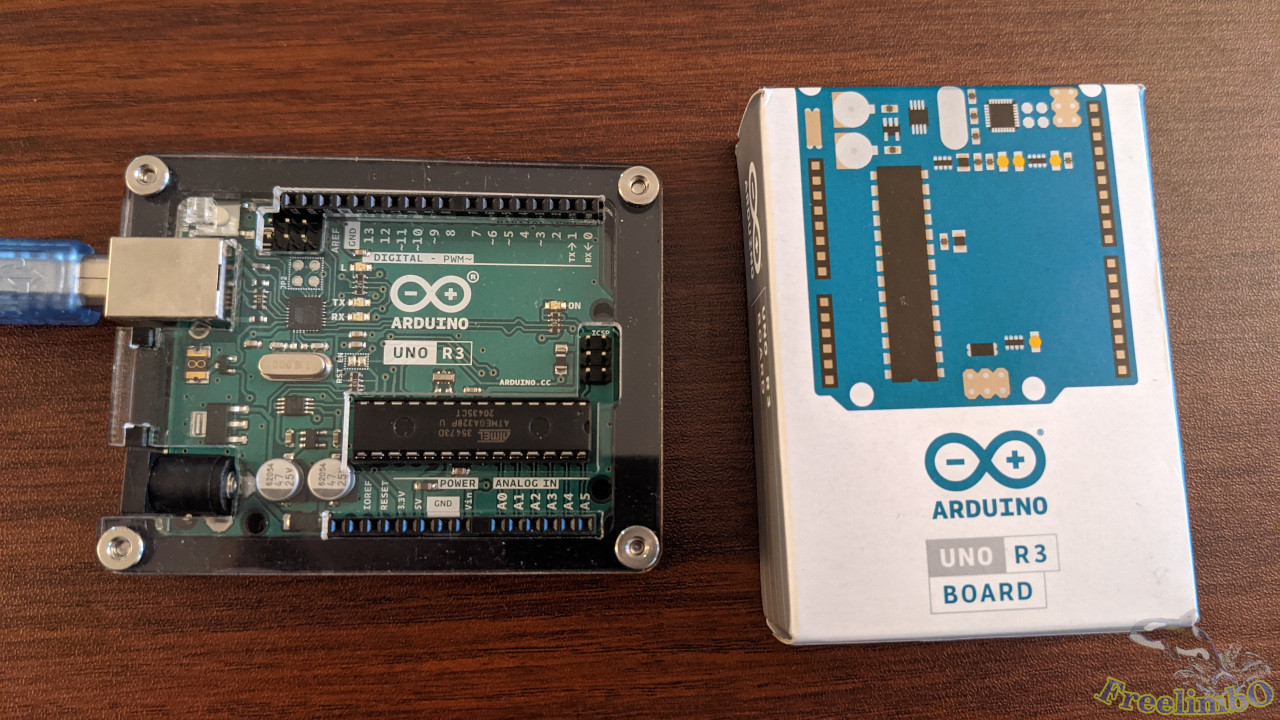
Arduino UNO R3 consumed very little energy. It could be powered by 9V 50mA from the power jack or 5V 40mA from the USB-A type jack. That sounded great because I would use the device no matter whether my gaming PC is turned on. I wanted this panel to keep working 24 hours and 7 days per week.
I found an artistic case for my Arduino. It seemed cut from an acrylic board, and the assembling process was creative since the case came in transparent plates. I stacked those plates to form a case. After being assembled, the case allowed all I/O ports exposed without an issue. Really cool and beautiful.
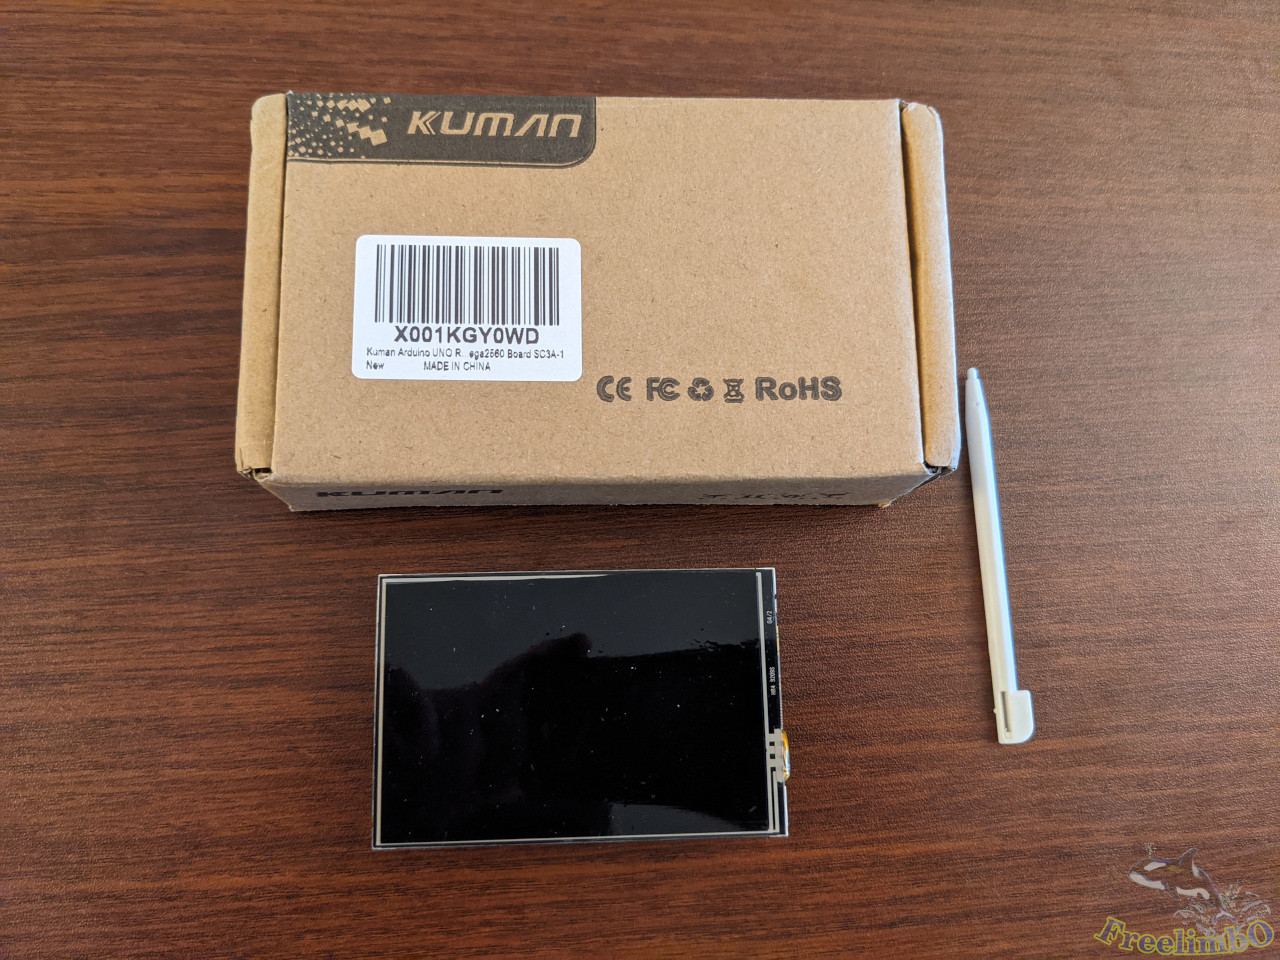
Display: Kuman 3.5" TFT LCD
 |
 |
| Top-view |
Bottom-view |
This 3.5" LCD display had a resolution of 320x480 pixels, which was good enough to show all the hardware information I needed. It came with a touch pen because it was actually a resistive touch panel, but I don’t need the touch screen. I would put the PC panel inside the transparent window of my Thermaltake Core V1 and let it run some programmed numbers and graphs.
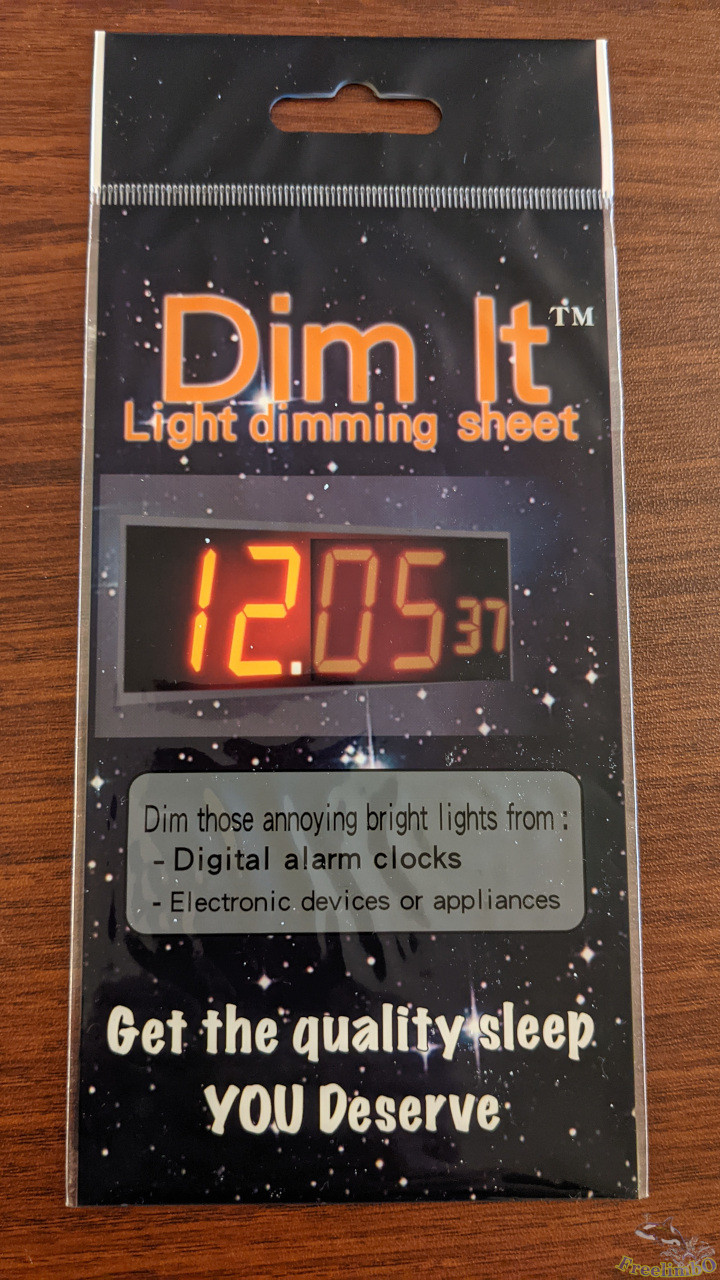
The only complaint I had was that there was no method to dim the brightness of this tiny LCD. It could make my eyes feel strained if I stare at the display too often. Some people tried to modify the circuit on the back of the LCD, but I would just like to try solving it with a filter.
Assembled Device
 |
 |
| Dim-It filter sheet |
Combining Arduino with the LCD |
This filter was easy to install on the display, and it worked great. The brightness was dimmed to a very comfortable level.
Stacking the LCD display onto the Arduino board was easy as well. It looked like a commercial product, right?
Design the Graphic Interface
Behaviors While the PC Powered On
I got a quite limited area to present the six readings, but I also want the graphic panel to be a bit fancy. So I came up a decent design for the six values I was interested in most:
- CPU load: An average loading percentage of multiple cores. Number.
- CPU temperature: Package temperature. A bent temperature meter.
- Memory load: Keep a history of previous memory usage. A histogram.
- GPU load: GPU Core loading or Video Engine. Number
- GPU temperature: GPU Core temperature. A bent temperature meter.
- GDDR load: GPU memory. A histogram.
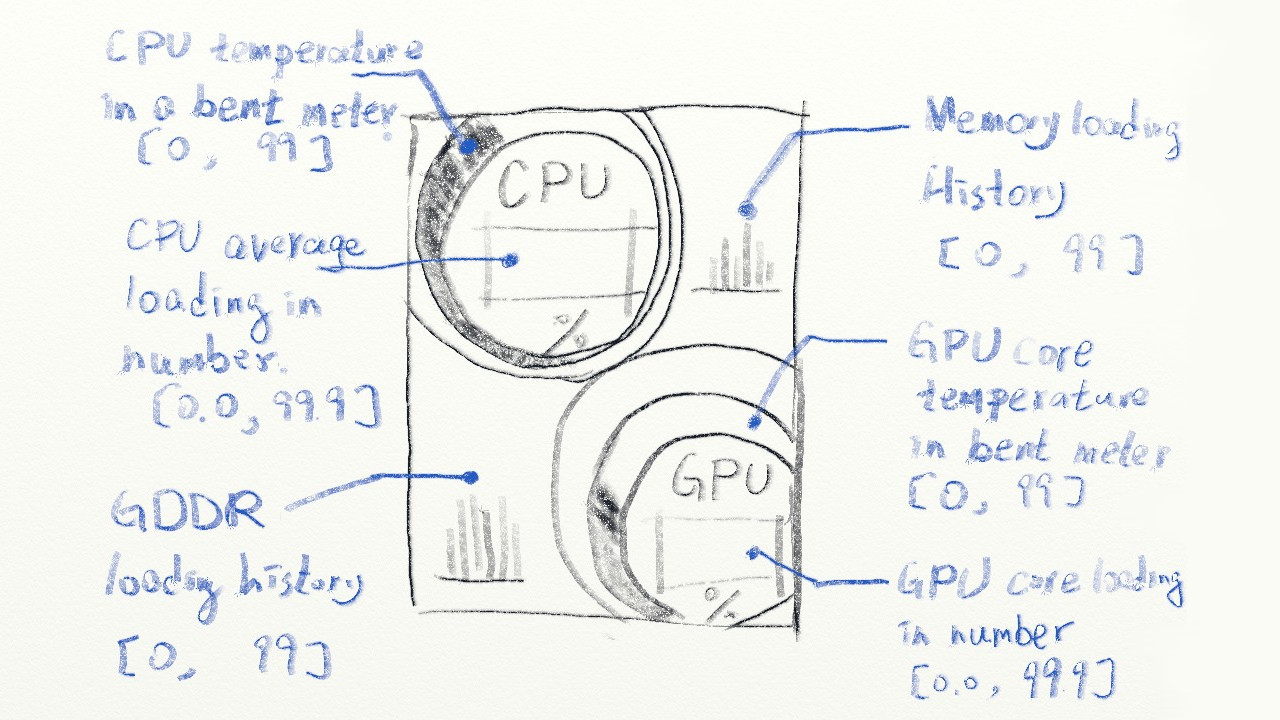
As shown above, there would be three kinds of presentation styles. Numbers showed the process loadings, bent meters showed the temperatures, and histograms showed the memory loadings. The upper part was for CPU-related information, while the lower was for GPU-related readings.
If applicable, I wanted the thermal meters to work like real ones. The levels must increase or decrease gradually, and the colors must be in a revert rainbow style. When the temperature rose to close to 100 degrees C, the tips of the levels should be close to red to represent the cores' heat.
For the histories in histograms, I designed them to roll from the very old memory loading to the latest. The rolling started from right to left, so that the latest loading would be on the right side.
Behaviors While I Shutdown the PC
Any gaming PC must be power-hungry, which meant I would shut the PC down while I was not playing games. Therefore, I would like to use the PC panel as a digital photo frame. I found the libraries and examples with the LCD included the implementation of a digital photo frame that directly fit my need. So this part was straightforward.
Here are the steps to prepare photos for the digital photo frame mode:
- I would need a micro-SD card.
- Prepare some photos cropped in 320x480 vertical in BMP format.
- Rename those photos in sequential numbers so that the Arduino program can easily iterate among the photos.
- Put all BMP photos in the micro-SD card directly without any folder directories.
Implementation
Because I was going to grab hardware information from my PC and present it on the tiny display, there are two parts to implement: the PC side, and the Arduino side.
Python Code on Windows PC
I found that the hosting PC had better be a Windows system so that OpenHardwareMonitor can grab the hardware information correctly. Please go ahead to the download page of Open Hardware Monitor for the tool. There might be some prerequisites like the Microsoft .NET framework to install.
The Python code can be divided into three parts:
- Serial port communication with Arduino.
- Search sensor indices in OpenHardwareMonitor.
- Detect readings and process the data.
Serial Port
 1
 2
 3
 4
 5
 6
 7
 8
 9
10
11
12
13
14
15
16
17
18
19
20
21
22
23
24
25
26
27
28
29
30
31
32
33
34
35
36
37
38
39
40
41
42
43
44
45
46
47
48
49
50
51
52
53
54
55
56
57
58
59
|
# -*- coding: utf-8 -*-
import serial
import time
from datetime import datetime
from datetime import timedelta
import wmi # Windows Management INstrumentation
import math

startMarker = '<'
endMarker = '>'
dataStarted = False
dataBuf = ""
messageComplete = False
isInitial = True

def setupSerial(baudRate, serialPortName):
    global  serialPort
    serialPort = serial.Serial(port= serialPortName, baudrate = baudRate, timeout=0, rtscts=True)
    print("Serial port " + serialPortName + " opened  Baudrate " + str(baudRate))
    waitForArduino()

def sendToArduino(stringToSend):
    global startMarker, endMarker, serialPort
    stringWithMarkers = (startMarker)
    stringWithMarkers += stringToSend
    stringWithMarkers += (endMarker)
    serialPort.write(stringWithMarkers.encode('utf-8')) # encode needed for Python3

def recvLikeArduino():
    global startMarker, endMarker, serialPort, dataStarted, dataBuf, messageComplete

    if serialPort.inWaiting() > 0 and messageComplete == False:
        x = serialPort.read().decode("utf-8") # decode needed for Python3

        if dataStarted == True:
            if x != endMarker:
                dataBuf = dataBuf + x
            else:
                dataStarted = False
                messageComplete = True
        elif x == startMarker:
            dataBuf = ''
            dataStarted = True
    if (messageComplete == True):
        messageComplete = False
        return dataBuf
    else:
        return "XXX"

def waitForArduino():
    print("Waiting for Arduino to reset")
    msg = ""
    while msg.find("Arduino is ready") == -1:
        msg = recvLikeArduino()
        if not (msg == 'XXX'):
            print(msg)

setupSerial(115200, "COM3") # For Windows
#setupSerial(115200, "/dev/ttyACM0") # For Ubuntu
|
Arduino used a USB serial port to transmit and receive messages to and from a hosting PC. These four functions were borrowed from the Arduino official forum. I didn’t modify it because it worked like a charm already. Credit to Robin2. They handled setup, sending, receiving, and filtering unwanted messages.
Search Sensor Index
 1
 2
 3
 4
 5
 6
 7
 8
 9
10
11
12
13
14
15
16
17
18
19
20
21
22
23
24
25
26
27
|
cpu_temp_index = 0;
cpu_load_indices = [0, 0, 0, 0, 0, 0, 0, 0]
gpu_temp_index = 0;
gpu_load_index = 0;
mem_index = 0;
gddr_index = 0;
w = wmi.WMI(namespace="root\\OpenHardwareMonitor")
sensors = w.Sensor()

def searchIndices():
    global w, sensors, cpu_temp_index, cpu_load_indices, gpu_temp_index, gpu_load_index, mem_index, gddr_index

    print("Checking index...")
    time.sleep(1)
    sensors = w.Sensor()

    dummyIdx = 0;

    for i, sensor in enumerate(sensors):
        if sensor.SensorType==u'Temperature' and 'CPU Package' == sensor.Name:
            cpu_temp_index = i
            print(i, sensor.Name, sensor.SensorType, sensor.Value)
        ...
        elif sensor.SensorType==u'Load' and 'GPU Memory' == sensor.Name:
        #elif sensor.SensorType==u'Clock' and 'GPU Memory' == sensor.Name:
            gddr_index = i
            print(i, sensor.Name, sensor.SensorType, sensor.Value/1500)
|
I used windows management instrumentation (WMI) to communicate with OpenHardwareMonitor. The sensor class attributes can be looked up from the GUI of OpenHardwareMonitor.
To increase the robustness and reduce the times for index searching, I wrapped the detection into function and only recorded the index of the six indices in the list of sensors. The actual detections were not done at this moment.
Reading Detection and Data Processing
 1
 2
 3
 4
 5
 6
 7
 8
 9
10
11
12
13
14
15
16
17
18
19
20
21
22
23
24
25
26
27
28
29
30
31
32
33
34
35
36
37
38
39
40
41
42
43
44
45
46
47
48
49
50
51
|
prevDateTime = datetime.now()
deltaThreshold = timedelta( seconds = 20)
diff = timedelta( seconds = 0)
deg = 0;
while True:
    arduinoReq = recvLikeArduino()
    if not (arduinoReq == u'XXX'):
        sensors = w.Sensor()
        currDateTime = datetime.now()
        diff = currDateTime - prevDateTime
        #print("now =", currDateTime, ", diff = ", diff)

        #print("isInitial: ", isInitial)
        #print("diff: ", diff)
        if isInitial or diff > deltaThreshold:
            searchIndices()
            isInitial = False

        prevDateTime = datetime.now()
        #print("now =", prevDateTime)

        try:
            cpu_temp = min(99.9, sensors[cpu_temp_index].Value)
            if cpu_temp == 0:
                isInitial = True
                continue
        except IndexError:
            print("cpu_temp_index out of range.")
            isInitial = True
            continue
        ...
        try:
            gddr = min(99.9, sensors[gddr_index].Value/1500*100)
        except IndexError:
            print("gddr_index out of range.")
            isInitial = True
            continue
				''' # Fake sinusoidal signal"
        rad = 6*deg / 180.0 * 3.1415926;
        mem = 20 + 20* math.sin(rad)
        deg += 1
				'''
        newString = "{:.1f}".format(cpu_temp)
        returnMsg = newString
        #print(cpu_temp_index, "CPU Temp: " + newString)
        ...
        newString = ",{:.1f}".format(gddr)
        returnMsg += newString
        #print("GPU Memory: " + newString)

        sendToArduino(returnMsg)
|
I found those indices could change after waking up from a sleep or hibernation. There must be some exception handler to trigger the sensor index detection function. Then, I formatted the string and send it to Arduino via the serial port.
I included a fake sinusoidal signal for early stage development if readers haven’t set up the OpenHardwareMonitor.
Arduino Code
The Arduino code implementing the graphic design includes four parts:
- Digital photo frame mode.
- Graphic presentation of sensor readings.
- Receiving serial port messages.
- The two core functions of Arduino.
Digital Photo Frame Mode
 1
 2
 3
 4
 5
 6
 7
 8
 9
10
11
12
13
14
15
16
17
18
19
20
21
22
23
24
25
26
27
28
29
30
31
32
33
34
35
36
37
38
39
40
41
42
43
44
45
46
47
48
49
50
51
52
53
54
55
56
57
58
59
60
61
62
63
64
65
66
67
68
69
70
71
72
73
74
|
uint16_t read_16(File fp) {
  uint8_t low;
  uint16_t high;
  low = fp.read();
  high = fp.read();
  return (high << 8) | low;
}

uint32_t read_32(File fp) {
  uint16_t low;
  uint32_t high;
  low = read_16(fp);
  high = read_16(fp);
  return (high << 16) | low;
}

bool analysis_bpm_header(File fp) {
  if (read_16(fp) != 0x4D42) {
    return false;
  }
  //get bpm size
  read_32(fp);
  //get creator information
  read_32(fp);
  //get offset information
  bmp_offset = read_32(fp);
  //get DIB infomation
  read_32(fp);
  //get width and heigh information
  uint32_t bpm_width = read_32(fp);
  uint32_t bpm_heigh = read_32(fp);
  if ((bpm_width != s_width) || (bpm_heigh != s_heigh)) {
    return false;
  }
  if (read_16(fp) != 1) {
    return false;
  }
  read_16(fp);
  if (read_32(fp) != 0) {
    return false;
  }
  return true;
}

void draw_bmp_picture(File fp) {
  uint16_t i, j, k, l, m = 0;
  uint8_t bpm_data[PIXEL_NUMBER * 3] = {0};
  uint16_t bpm_color[PIXEL_NUMBER];
  fp.seek(bmp_offset);
  for (i = 0; i < s_heigh; i++) {
    for (j = 0; j < s_width / PIXEL_NUMBER; j++) {
      m = 0;
      fp.read(bpm_data, PIXEL_NUMBER * 3);
      for (k = 0; k < PIXEL_NUMBER; k++) {
        bpm_color[k] = my_lcd.Color_To_565(bpm_data[m + 2], bpm_data[m + 1], bpm_data[m + 0]); //change to 565
        m += 3;
      }
      for (l = 0; l < PIXEL_NUMBER; l++) {
        my_lcd.Set_Draw_color(bpm_color[l]);
        my_lcd.Draw_Pixel(j * PIXEL_NUMBER + l, 479 - i);
      }
    }
  }
}

void setupSD() { //Init SD_Card
  pinMode(PIN_SD_CS, OUTPUT);
  if (!SD.begin(PIN_SD_CS)) {
    my_lcd.Set_Text_Back_colour(BLUE);
    my_lcd.Set_Text_colour(WHITE);
    my_lcd.Set_Text_Size(1);
    my_lcd.Print_String("SD Card Init fail!", 0, 0);
  }
}
|
The first part was evolved from the official example of the TFT LCD. There were only two things noteworthy. The left shift in read_32(.) function should be 16, and the my_lcd.Draw_Pixel(.)’s y-index should be reverted to show the BMP image correctly; otherwise, all pictures would be up-side-down.
Graphic Presentation of Sensor Readings
OK, this part is the hardest one. I should walk you through every sections.
 1
 2
 3
 4
 5
 6
 7
 8
 9
10
11
12
13
14
15
16
17
18
19
20
21
22
|
boolean newData = false;
float values[6];
float prevValues[6];
int nonzeroCounter = 0; // Count how many nonzeros are received.
uint16_t colorsCPU[5] = {MAGENTA, YELLOW, DARK_GREEN, RED, BLUE};
uint16_t colorsGPU[5] = {GREEN, GREEN_BLUE, DARK_GREEN,  BLUE, BLACK};

uint16_t rainbow[15] = {
  0x02FF, 0x04BF, 0x061F,
  0x07FF, 0x07F7, 0x07EF,
  0x5FE0, 0x97E0, 0xCFE0,
  0xFFE0, 0xFE60, 0xFCA0,
  0xFAE0, 0xF980, 0xF800
};

typedef struct st_c {
  int x;
  int y;
  int r;
  uint16_t c;
} cntr;
cntr prevC[2];
|
Some color code definitions. I defined two arrays of colors for CPU and GPU concentric circles. The rainbow color codes were for the thermal meters. Then, I defined a structure for the circle information passing into the latter functions.
 1
 2
 3
 4
 5
 6
 7
 8
 9
10
11
12
13
14
15
16
17
18
19
20
21
22
23
24
25
26
27
28
29
30
|
struct st_c drawCircules(int sensorType, int cx, int cy, int devi, uint16_t colors[5]) {
  int radius = 140;
  uint16_t color;

  for (int i = 0; i < 4; i++) {
    radius -= 2 * devi;
    color = colors[i];
    cy += devi;
    my_lcd.Set_Draw_color(color);
    my_lcd.Fill_Circle(cx, cy, radius);
  }
  my_lcd.Set_Text_Back_colour(colors[3]);
  my_lcd.Set_Text_colour(colors[4]);
  my_lcd.Set_Text_Size(5);

  switch (sensorType) {
    case CPU_TEMP:
    case CPU_LOAD:
      my_lcd.Print_String("CPU", cx - 37, cy - 67);
      break;
    case GPU_TEMP:
    case GPU_LOAD:
      my_lcd.Print_String("GPU", cx - 37, cy - 67);
      break;
  }

  my_lcd.Print_String("%", cx - 5 , cy + 40);
  cntr last_cntr = {.x = cx , .y = cy, .r = radius, .c = color};
  return last_cntr;
}
|
This function drew four deviated concentric circles and put some words on the innermost circle. Then, I returned the circle’s information for CPU and GPU’s loading updates.
 1
 2
 3
 4
 5
 6
 7
 8
 9
10
11
12
13
14
15
16
17
18
19
20
21
22
23
24
25
26
27
28
29
30
|
void drawTemp(int sensorType, struct st_c c, int devi) {
  cntr innerC = c;
  cntr outerC = {c.x, c.y - devi, c.r + 2 * devi, c.c};
  float x1, y1, x2, y2;
  float temp = values[sensorType];
  float maxDegree = temp / 100.0 * 360.0;
  maxDegree = min(360, (int)maxDegree);
  float prevMaxDegree = prevValues[sensorType] / 100.0 * 360.0;
  int stepping = 0;
  if (maxDegree != prevMaxDegree) { // Only plot the difference
    stepping = (maxDegree > prevMaxDegree) ? (1) : (-1);
    for (int i = prevMaxDegree; i != maxDegree; i += stepping) {
      float rad = ((float)i + 90.0) / 180.0 * PI;
      x1 = innerC.x + innerC.r * cos(rad); //Polar to cardinal
      y1 = innerC.y + innerC.r * sin(rad);
      x2 = outerC.x + outerC.r * cos(rad);
      y2 = outerC.y + outerC.r * sin(rad);
      if (stepping >= 0) {
        //tft.drawLine(x1, y1, x2, y2, tft.color565(i,i,254));
        my_lcd.Set_Draw_color(rainbow[(int)min(14, (float)i / 360.0 * 19.0)]);
        my_lcd.Draw_Line(x1, y1, x2, y2);
      } else {
        my_lcd.Set_Draw_color(DARK_GREEN);
        my_lcd.Draw_Line(x1, y1, x2, y2);
      }
    }
    prevValues[sensorType] = values[sensorType];
  }
  values[sensorType] = 0.0;
}
|
The bent thermal meter would be drawn outside the innermost circle. I figured out a method to fill in colors in the gap of the concentric circles, which was to draw lines instead of filled rectangles. Drawing line segments can create an illusion of color gradient. I used the tilt angle to select a color in the rainbow color map.
The drawing of the line segments started from six o’clock and proceeded clockwise. Once the temperature decreased, I started to draw DARK_GREEN segments counter-clockwise. This behavior mimicked the pointer readings on a car dashboard.
 1
 2
 3
 4
 5
 6
 7
 8
 9
10
11
12
13
|
void updateNumber(int censorType, int x, int y, int16_t color) {
  my_lcd.Set_Text_colour(color);
  my_lcd.Set_Text_Size(6);

  if (censorType == CPU_LOAD) {
    my_lcd.Set_Text_Back_colour(colorsCPU[3]);
  } else {
    my_lcd.Set_Text_Back_colour(colorsGPU[3]);
  }
  my_lcd.Print_Number_Float(values[censorType], 0, x, y, '.', 0, ' ');
  values[censorType] = 0.0;
  newData = false;
}
|
This function updated CPU and GPU’s loading percentages.
 1
 2
 3
 4
 5
 6
 7
 8
 9
10
11
12
13
14
15
16
17
18
19
20
21
22
23
24
25
26
27
28
29
30
31
32
33
34
35
|
float memHistory[25];
float gddrHistory[25];
void plotHist(int sensorType, int x, int y, uint16_t c) {
  int width = 50, height = 100;
  int lbx = x, lby = y;

  my_lcd.Set_Draw_color(BLACK);
  my_lcd.Fill_Rectangle(lbx, lby, lbx + width, lby + height + 2);

  float *ptr0;
  switch (sensorType) {
    case MEM:
      ptr0 = memHistory;
      break;
    case GDDR:
      ptr0 = gddrHistory;
      break;
  }

  for (byte i = 0; i < 25; i++) {
    int len0 = (int)ptr0[i];
    int top0 = lby + height - len0;
    my_lcd.Set_Draw_color(c);
    my_lcd.Draw_Fast_VLine(lbx + 2 * i, top0, len0);
    my_lcd.Draw_Fast_VLine(lbx + 2 * i + 1, top0, len0);
    if (i < 24) {
      my_lcd.Set_Draw_color(CYAN);
      my_lcd.Draw_Line(lbx + 2 * i, top0, lbx + 2 * (i + 1) + 1, lby + height - (int)ptr0[i + 1]);
      ptr0[i] = ptr0[i + 1];
    } else {
      ptr0[i] = values[sensorType];
      values[sensorType] = 0;
    }
  }
}
|
Every time when I refreshed the frame, I redrew the memory histogram. The histogram was composed of vertical lines and an envelope. The vertical line’s starting and ending y-positions were a bit complicated, but I have already done the calculation for you.
 1
 2
 3
 4
 5
 6
 7
 8
 9
10
11
12
13
14
15
16
17
|
void setupStat() {
  my_lcd.Fill_Screen(BLACK);
  prevC[0] = drawCircules(CPU_TEMP, 100, 105, 6, colorsCPU);
  prevC[1] = drawCircules(GPU_TEMP, 190, 340, 6, colorsGPU);
}

void updateStat() {
  int halfw = 0.85 * prevC[0].r, halfh = 0.5 * prevC[0].r;

  drawTemp(CPU_TEMP, prevC[0], 6);
  updateNumber(CPU_LOAD, prevC[0].x - halfw + 12, prevC[0].y - 15, WHITE);
  plotHist(MEM, prevC[0].x + halfw + 16 + 40, prevC[0].y - 15 - 70, MAGENTA);

  drawTemp(GPU_TEMP, prevC[1], 6);
  updateNumber(GPU_LOAD, prevC[1].x - halfw + 12, prevC[1].y - 15, CYAN);
  plotHist(GDDR, prevC[1].x - halfw - 100, prevC[1].y - 40, BLUE);
}
|
The last two functions in this part was to wrap all the sub-routines together. I split them into a setup function for the background, and the update function for the redrawing of foreground numbers and patterns.
Receiving Serial Port Messages
 1
 2
 3
 4
 5
 6
 7
 8
 9
10
11
12
13
14
15
16
17
18
19
20
21
22
23
24
25
26
27
28
29
30
31
32
33
34
35
36
37
|
unsigned long prevTime, currTime;
void recvWithStartEndMarkers() {
  byte rid = 0; byte cid = 0;
  static boolean recvInProgress = false;
  static byte ndx = 0;
  char startMarker = '<';
  char endMarker = '>';
  char rc;
  char receivedChars[4];
  while (Serial.available() > 0 && newData == false) {
    rc = Serial.read();

    if (recvInProgress == true) {
      if (rc == endMarker) {
        recvInProgress = false;
        values[rid] = atof(receivedChars);
        for (byte i = 0; i < 4; i++) receivedChars[i] = ' ';
        if (values[rid] != 0) nonzeroCounter++;
        rid = 0;
        cid = 0;
        newData = true;
      } else if (rc == ',') {
        values[rid] = atof(receivedChars);
        for (byte i = 0; i < 4; i++) receivedChars[i] = ' ';
        if (values[rid] != 0) nonzeroCounter++;
        rid++;
        cid = 0;
      } else {
        receivedChars[cid] = rc;
        cid++;
      }
    } else if (rc == startMarker) {
      recvInProgress = true;
      prevTime = millis();
    }
  }
}
|
This part was evolved from Robin2’s codes on Arduino official forum. I modified a little bit to enhance the robustness.
The Two Core Functions of Arduino
 1
 2
 3
 4
 5
 6
 7
 8
 9
10
11
12
13
14
15
16
17
18
19
20
21
22
23
24
25
26
27
28
29
30
31
32
33
34
35
36
37
38
39
40
41
42
43
44
45
46
47
48
49
50
51
52
53
54
55
56
57
58
59
60
61
62
63
64
65
66
67
68
69
70
71
|
void setup(void) {
  Serial.begin(115200);
  Serial.println("<Arduino is ready!>");

  my_lcd.Init_LCD();
  my_lcd.Fill_Screen(BLUE);
  my_lcd.Set_Rotation(0);

  setupSD();
  setupStat();
}

boolean enteredS3 = false;
byte skipCounter = 0;
byte imgCounter = 0;
void loop(void) {
  Serial.flush();
  currTime = millis();
  if (currTime - prevTime > 6000) { // Test if the host PC enters S3/S4
    newData = false;
    prevValues[CPU_TEMP] = 0;
    prevValues[GPU_TEMP] = 0;
  }
  Serial.println("<Req...>");
  recvWithStartEndMarkers();
  byte threshold = 5;
  if (nonzeroCounter == 0) { // Boundry check of [0, threshold]
    skipCounter = (skipCounter < threshold) ? (skipCounter + 1) : (threshold);
  } else {
    skipCounter = (skipCounter > 0) ? (skipCounter - 1) : (0);
  }

  if (skipCounter < threshold) {
    if (enteredS3) {
      setupStat();
      enteredS3 = false;
    }
    updateStat();
  }
  else {
    if (!enteredS3) {
      setupSD();
      enteredS3 = true;
      imgCounter = 1;
    }

    File bmp_file = SD.open((String("0") + imgCounter + String(".bmp")).c_str());
    imgCounter = (imgCounter == FILE_NUMBER) ? (1) : (imgCounter + 1);
    if (!bmp_file) {
      my_lcd.Set_Text_Back_colour(BLUE);
      my_lcd.Set_Text_colour(WHITE);
      my_lcd.Set_Text_Size(1);
      my_lcd.Print_String("didnt find BMPimage!", 0, 10);
      while (1);
    }
    if (!analysis_bpm_header(bmp_file)) {
      my_lcd.Set_Text_Back_colour(BLUE);
      my_lcd.Set_Text_colour(WHITE);
      my_lcd.Set_Text_Size(1);
      my_lcd.Print_String("bad bmp picture!", 0, 0);
      return;
    }
    draw_bmp_picture(bmp_file);
    bmp_file.close();

    delay(2000);
  }

  nonzeroCounter = 0;
  delay(2000);
}
|
The last part of the Arduino code included setup() and loop(). I added two guarding flags enteredS3 and skipCounter to make sure the entering and exiting sleep/hibernation behavior can work flawlessly.
The code can be downloaded from my GitHub repo.
Please note that I also trimmed the Arduino libraries to make the entire code smaller than 32KB, or I cannot upload the script to Arduino.
Good to Go
With everything implemented, I connected my Arduino PC panel to my gaming PC, turn on OpenHardwareMonitor, and run the python code.
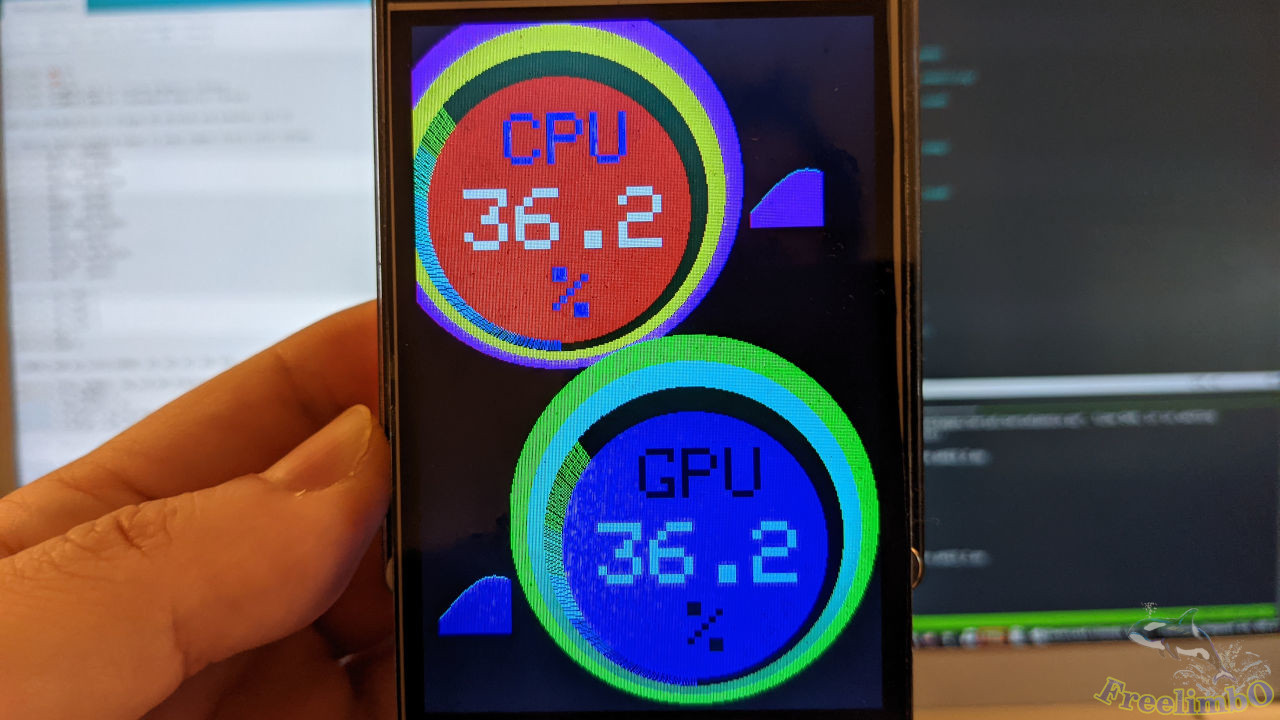
Everything worked as I designed. Great!
That’s it. 😄 I went ahead to install this status panel into the transparent window of my PC chassis. While playing games, I can easily check my hardware status with this small device without sacrificing any screen area on my gaming monitor.